Image Details
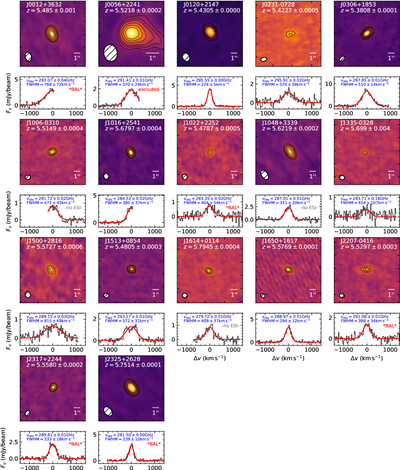
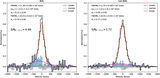
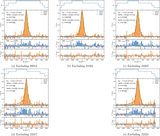
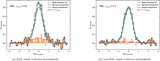
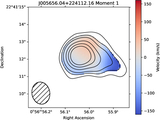
Caption: Figure A1.
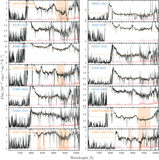
[C II] 158μm emission maps and spectra of the quasar sample observed with ALMA. Contours show (2σ, 3σ, 4σ, 6σ, 8σ, and 10σ) levels. The synthesized beam is shown in the lower-left corner of each map. Measured redshifts are labeled for each quasar, and red curves show the best Gaussian fits. Observed frequency and FWHM of the [C II] emission are also provided for reference. Quasars with significant BAL features are labeled, while those without ESI spectra are marked as “no ESI.” Since J0056 exhibits very extended [C II] emission in the image, it has been excluded from the stacking analysis.
Other Images in This Article
Copyright and Terms & Conditions
© 2026. The Author(s). Published by the American Astronomical Society.
Copyright ©
2026 Astronomy Image Explorer. All Rights Reserved.