Image Details
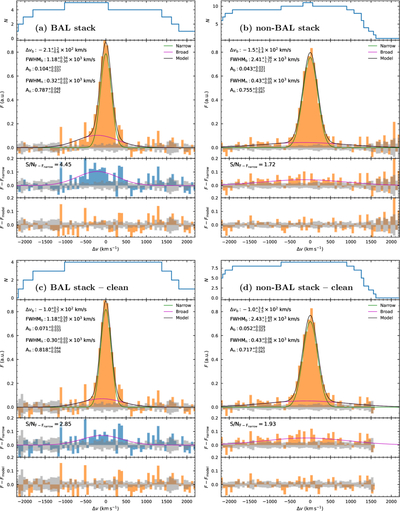
Caption: Figure 1.
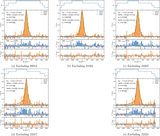
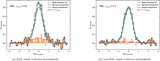
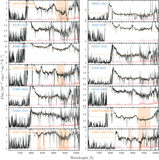
Stacked [C II] spectra. (a) Stacked [C II] profile for the BAL quasar sample. The top panel shows the number of spectra contributing to the stack at each velocity bin (Δv). The second panel displays the normalized [C II] flux, with the best-fit narrow (green) and broad (cyan) Gaussian components. The combined model is shown in black, with a broad component centered at Δvb = −2.1 × 10² km s−1 and an FWHM of 1.18 × 10³ km s−1. The residuals between the total flux and the narrow component are shown in the third panel, highlighting the significance of the broad residual (mean S/N = 4.45 within the FWHM). The bottom panel shows the overall residuals after subtracting the total model. (b) Stacked [C II] profile for the non-BAL quasar sample. The profile shows no obvious broad residual, with residuals below 2σ. Panels (c) and (d) provide a conservative “clean-stack” check excluding quasars with partial [C II] spectral coverage.
Other Images in This Article
Copyright and Terms & Conditions
© 2026. The Author(s). Published by the American Astronomical Society.