Image Details
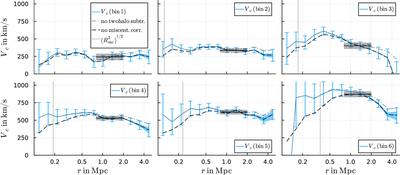
Caption: Figure 9.
The stacked mass profiles M(r) of the GAMA groups in each bin in terms of the implied circular velocity ﹩{V}_{c}(r)=\sqrt{GM(r)/r}﹩ (solid blue lines). The blue band indicates the systematic uncertainty from extrapolating ΔΣl beyond the last measured data point (Appendix A.2.2). Error bars indicate the statistical uncertainties. Dashed vertical lines indicate the estimated miscentering offsets ﹩\sqrt{\langle {R}_{{\rm{mc}}}^{2}\rangle }﹩ that we correct for. Dashed black lines indicate the Vc we obtain without this miscentering correction. The miscentering correction is valid only at radii significantly larger than the miscentering offset (Appendix A.2.3). Dashed–dotted gray lines indicate the Vc we obtain without subtracting the two-halo term (Appendix A.2.6). Miscentering is important at small radii, and the two-halo term is important at large radii. The shaded black region indicates Vf, its statistical uncertainty, and the radial range from which it is calculated.
Other Images in This Article


Copyright and Terms & Conditions
© 2026. The Author(s). Published by the American Astronomical Society.