Image Details

Caption: Figure 3.
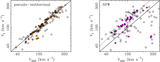
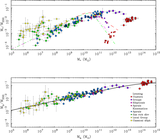
The flat-equivalent circular velocity of extragalactic systems as a function of stellar mass (top panel) and baryonic mass (bottom panel). Data for rotationally supported galaxies are depicted by circles; squares represent pressure supported systems. The blue circles are galaxies with directly measured distances, Vf from rotation curves, and stellar masses from WISE photometry from F. Duey et al. (2026, in preparation). Green circles are gas-rich galaxies (Mg > M*; D. V. Stark et al. 2009; C. Trachternach et al. 2009; E. Z. Bernstein-Cooper et al. 2014; A. T. McNichols et al. 2016; G. Iorio et al. 2017; B. Namumba et al. 2025; J.-L. Xu et al. 2025) not in F. Duey et al. (2026, in preparation). Yellow points are Local Group galaxies, both spirals and dwarfs (S. S. McGaugh et al. 2021); gray squares are ultrafaint dwarfs (F. Lelli et al. 2017). Lensing results for early- and late-type galaxies (T. Mistele et al. 2024a) are shown as pink squares and magenta circles, respectively. Red squares are clusters of galaxies (T. Mistele et al. 2025), and purple squares are groups of galaxies (this work). The orange line is the BTFR (Equation (8)).
Other Images in This Article


Copyright and Terms & Conditions
© 2026. The Author(s). Published by the American Astronomical Society.