Image Details
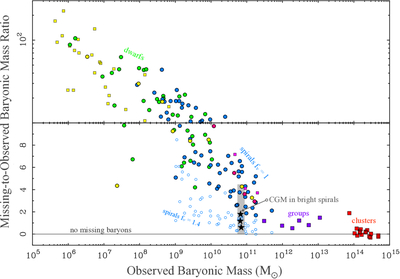
Caption: Figure 7.
The ratio of missing-to-observed baryonic mass as a function of baryonic mass. Data and symbols are the same as in Figure 3. The ratio is linear in the bottom half of the diagram, then switches to logarithmic in the top half. Spiral galaxies of the WISE-SPARC sample are shown twice: once with fv = 1.0 (solid blue circles) and again with fv = 1.4 (small open circles). The Milky Way is the yellow point at the top of the gray band, which shows the range from zero CGM to that required to explain all of the locally missing baryons when fv = 1. Stars represent the CGM measurements of Milky Way–mass galaxies by M. J. Miller & J. N. Bregman (2015), J. N. Bregman et al. (2022), and Y. Zhang et al. (2025b) from bottom to top.
Other Images in This Article


Copyright and Terms & Conditions
© 2026. The Author(s). Published by the American Astronomical Society.