Image Details
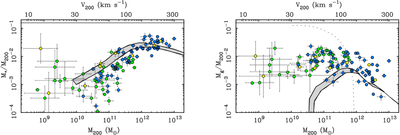
Caption: Figure 6.
The stellar mass fraction (left panel) and gas mass fraction (right panel) as a function of mass M200 with the equivalent V200 on the top axis. Data and symbols are the same as in Figure 3; the sample is restricted to objects for which both stars and gas are directly measured for each galaxy. The lines show the expectation for central subhalos in the EAGLE simulations (P. D. Mitchell & J. Schaye 2022) with the width of the gray bands representing the range of fv from 1 (bottom edge) to 1.4 (top edge). The dotted line in the right panel denotes the limit where gas is precluded from accreting onto halos in the EAGLE simulations.
Other Images in This Article


Copyright and Terms & Conditions
© 2026. The Author(s). Published by the American Astronomical Society.