Image Details
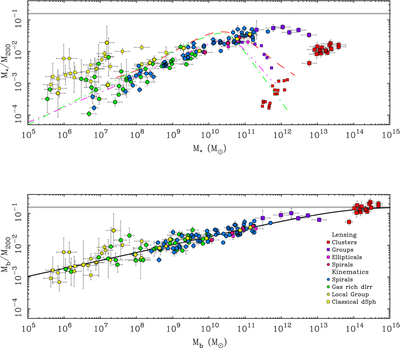
Caption: Figure 4.
The stellar mass fraction as a function of stellar mass (top) and the baryonic mass fraction as a function of baryonic mass (bottom). Data and symbols as in Figure 3 with the additional distinction that large squares in the top panel represent the sum of the stellar mass of all galaxies in a group or cluster while small squares are the stellar mass of the brightest galaxy only. The horizontal line is the cosmic baryon fraction fb = 0.157 (Planck Collaboration et al. 2020). The colored lines in the top panels show the stellar mass–halo mass relations from abundance matching given by B. P. Moster et al. (2013; dashed–dotted green line), P. S. Behroozi et al. (2013; dashed–triple dotted pink line), and A. V. Kravtsov et al. (2018; red dashed line). The black line in the lower panel is Equation (12).
Other Images in This Article


Copyright and Terms & Conditions
© 2026. The Author(s). Published by the American Astronomical Society.