Image Details
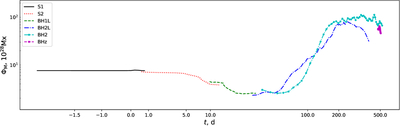
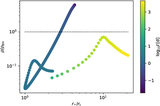
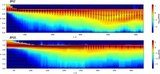
Caption: Figure 11.
One-sided magnetic field flux as a function of time. Different curves represent different simulation stages: S1 (black solid), S2 (red dotted), BH 1L (green dashed), BH 2L (blue dotted–dashed), BH 2 (teal dashed with thick dots), and BHz (thick solid magenta line).
Other Images in This Article
Show More
Copyright and Terms & Conditions
© 2026. The Author(s). Published by the American Astronomical Society.
Copyright ©
2026 Astronomy Image Explorer. All Rights Reserved.