Image Details
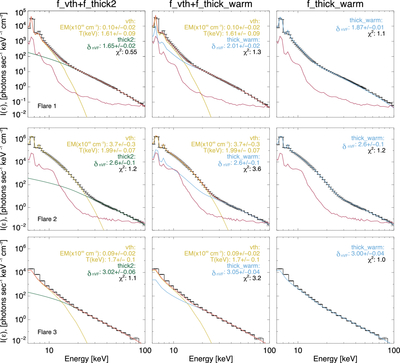
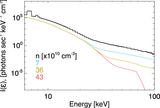
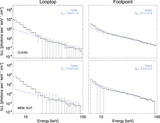
Caption: Figure 7.
A comparison of spectral fittings for each flare. The left, middle, and right columns show spectral fittings when using f_vth+f_thick2, f_vth+f_thick_warm, and f_thick_warm, respectively.
Other Images in This Article
Show More
Copyright and Terms & Conditions
© 2026. The Author(s). Published by the American Astronomical Society.
Copyright ©
2026 Astronomy Image Explorer. All Rights Reserved.