Image Details
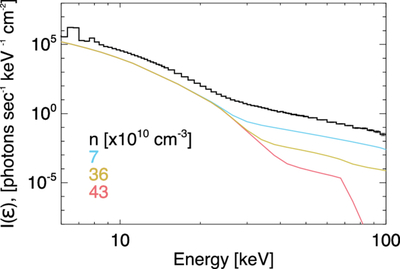
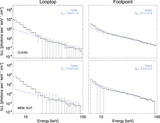
Caption: Figure 8.
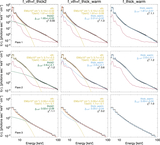
Observed photon flux spectrum of Flare 2 (black) compared to the simulated photon flux spectrum (blue) for simulations using n = 7 × 10¹⁰, 36 × 1010, and 43 × 1010 cm−3, shown by the blue, yellow, and pink curves, respectively.
Other Images in This Article
Show More
Copyright and Terms & Conditions
© 2026. The Author(s). Published by the American Astronomical Society.
Copyright ©
2026 Astronomy Image Explorer. All Rights Reserved.