Image Details
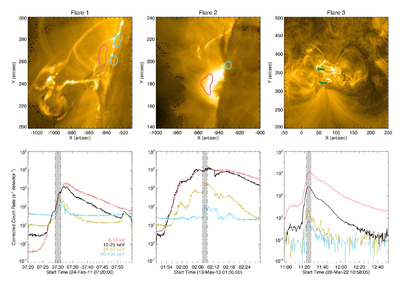
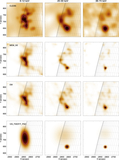
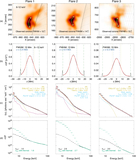
Caption: Figure 1.
Top row: SDO/AIA 171 Å images of Flare 1 (left), Flare 2 (middle), and Flare 3 (right). Pink and blue contours show the 50% intensity levels of the 6–12 keV and 50–100 keV X-ray emission, respectively. Flare ribbons observed in 1700 Å are shown by the green 50% contours for Flare 3. Bottom row: corresponding light curves for each event. The gray shaded boxes highlight the time periods studied here for each flare.
Other Images in This Article
Show More
Copyright and Terms & Conditions
© 2026. The Author(s). Published by the American Astronomical Society.
Copyright ©
2026 Astronomy Image Explorer. All Rights Reserved.