Image Details
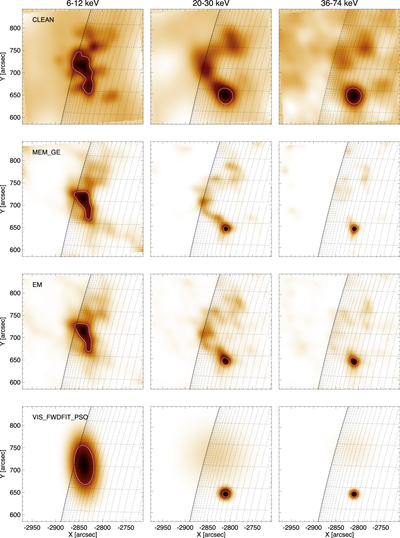
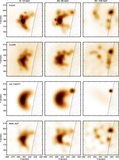
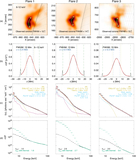
Caption: Figure 5.
Flare 3, STIX imaging. Columns left to right: STIX 6–12 keV, 20–30 keV, and 36–74 keV images. Rows show different imaging algorithms, top to bottom: CLEAN (CLEAN beamwidth = 2.0), MEM_GE, EM, and VIS_FWDFIT_PSO. Column 1 shows a white contour of the looptop, defined as the 50% contour of the 6–12 keV emission. The white contours in Columns 2 and 3 highlight footpoints, defined as the 50% contour of the 36–74 keV emission.
Other Images in This Article
Show More
Copyright and Terms & Conditions
© 2026. The Author(s). Published by the American Astronomical Society.
Copyright ©
2026 Astronomy Image Explorer. All Rights Reserved.