Image Details
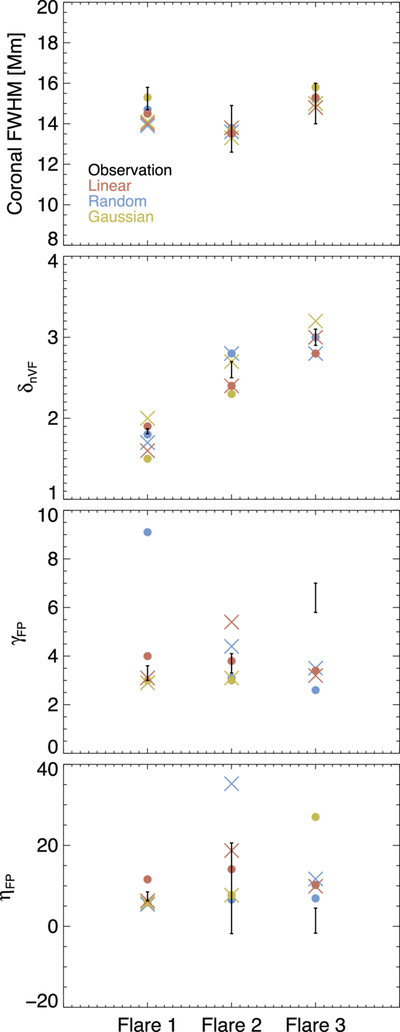
Caption: Figure 12.
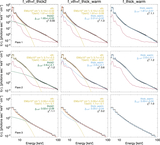
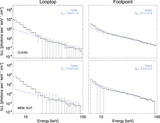
Comparing the observed and modeled spectral and imaging diagnostics: coronal source FWHM, δnV F, γFP, and ﹩{\eta }_{{\rm{FP}}}^{\rm{X-ray}}﹩, from top to bottom. The acceleration regions for three different spatial functions are shown in different colors: linear spatial functions in pink, random functions in blue, and Gaussian functions in yellow. Crosses and circles show acceleration regions with and without short-timescale turbulent scattering, respectively.
Other Images in This Article
Show More
Copyright and Terms & Conditions
© 2026. The Author(s). Published by the American Astronomical Society.
Copyright ©
2026 Astronomy Image Explorer. All Rights Reserved.