Image Details
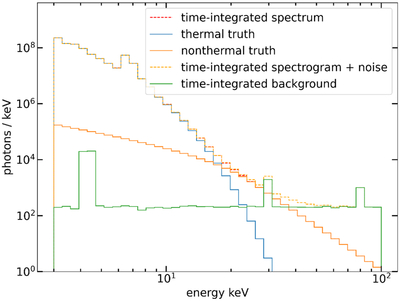
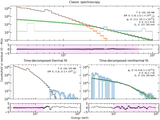
Caption: Figure 9.
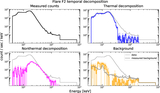
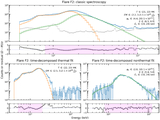
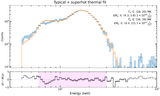
Simulated, time-integrated flare spectrum for the typical solar flare. The “truth” components show the individual thermal/nonthermal photon spectra. The dashed red line shows the composite spectrum without background, and the dashed orange one shows it with background.
Other Images in This Article
Show More
Copyright and Terms & Conditions
© 2026. The Author(s). Published by the American Astronomical Society.
Copyright ©
2026 Astronomy Image Explorer. All Rights Reserved.