Image Details
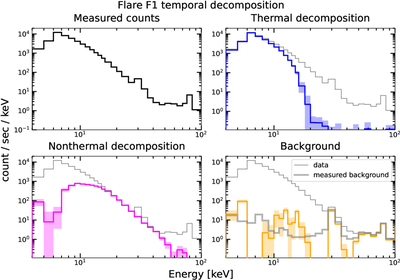
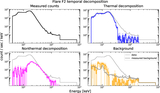
Caption: Figure 2.
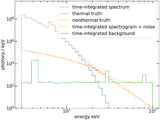
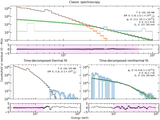
Time-decomposed spectra from Flare F1. The first panel shows the measured data; the second shows the time-decomposed thermal emission (blue); the third shows the time-decomposed nonthermal emission (magenta); the fourth panel shows the measured (gray) and time-decomposed (orange) backgrounds. Using only temporal variation to define the pseudobases in Equation (2), the spectra capture the background, thermal emission, and nonthermal emission with physically realistic spectral shapes, despite no spectroscopy yet being performed. In the fourth panel, a measured background from 2022 April 19 is overplotted on the decomposition. The decomposition technique captures the background well when its intensity is at least the order of that of the flare.
Other Images in This Article
Show More
Copyright and Terms & Conditions
© 2026. The Author(s). Published by the American Astronomical Society.