Image Details
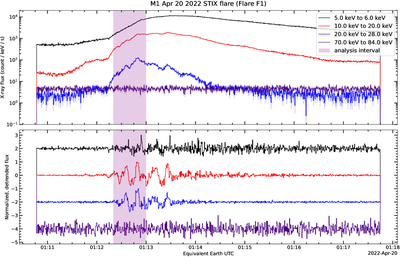
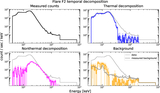
Caption: Figure 1.
X-ray light curves for an M-class flare observed by Solar Orbiter/STIX; we call this Flare F1. The pink region is the analysis interval. The red and blue curves correspond to higher-energy X-rays, and the detrended plots show how these exhibit relatively more intense variations within the analysis interval than the lower-energy (black) light curve does. The indigo curve is the detector background, entirely composed of uncorrelated shot noise. The detrended curves are high-pass filtered. The detrending was performed using a zero-lag fifth-order low-pass Butterworth filter with a cutoff frequency corresponding to 20 s (S. Butterworth et al. 1930; F. Gustafsson 1996).
Other Images in This Article
Show More
Copyright and Terms & Conditions
© 2026. The Author(s). Published by the American Astronomical Society.