Image Details
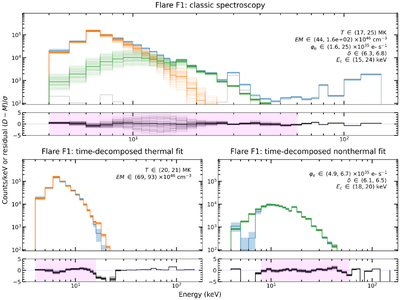
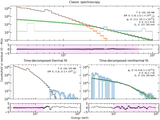
Caption: Figure 3.
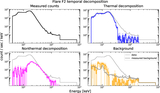
Comparison of traditional versus time-decomposed spectroscopy for Flare F1 (M1 class 2022 Apr 20). The blue lines are the data, orange lines are the thermal bremsstrahlung fits, and green lines are the cold thick-target fits. The pink regions in the residual plots indicate the energy fitting ranges. The top panel shows traditional spectroscopy, and the bottom two panels show the results from the time-decomposed fits. The plots are annotated with 95% χ2 parameter intervals. We restrict the fit to regions where the decomposed spectrum is ≥5% of the total spectrum, and where the error bars are ≤50% of the mean value.
Other Images in This Article
Show More
Copyright and Terms & Conditions
© 2026. The Author(s). Published by the American Astronomical Society.