Image Details
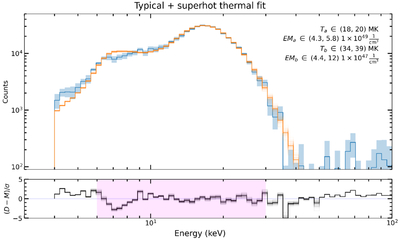
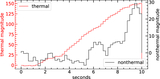
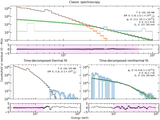
Caption: Figure 7.
We fit two isothermal bremsstrahlung emission functions to the time-decomposed Flare F2 thermal spectrum. The data is shown in blue, and the summed temperature model in orange. Parameters for each model are annotated.
Other Images in This Article
Show More
Copyright and Terms & Conditions
© 2026. The Author(s). Published by the American Astronomical Society.
Copyright ©
2026 Astronomy Image Explorer. All Rights Reserved.