

Image Details
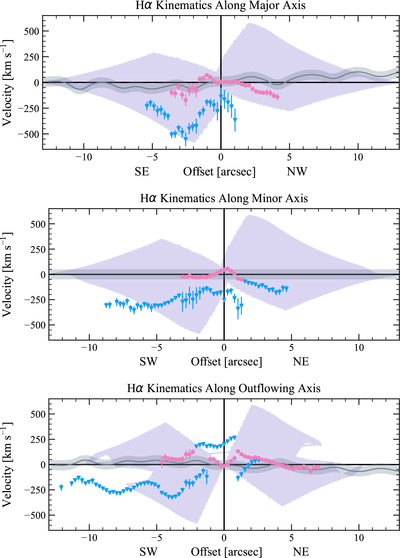
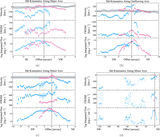
Caption: Figure 8.
Hα kinematic plots with symbols and color scheme as in Figure 6. The “0” position represents the nucleus as defined by the continuum peak. The purple shaded regions show the model velocity areas from the bicone model, and represent the range of velocities produced by the bicone model at each position.
Other Images in This Article
Show More
Copyright and Terms & Conditions
© 2026. The Author(s). Published by the American Astronomical Society.

Copyright ©
2026 Astronomy Image Explorer. All Rights Reserved.
