

Image Details
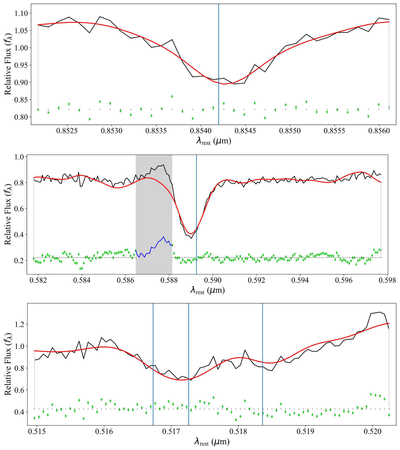
Caption: Figure 4.
Example pPXF fits for NGC 7319 at a position of 1﹩\mathop{.}\limits^{^{\prime\prime} }﹩032 from the nucleus. Black is the log-rebinned spectrum. The blue vertical line is the rest wavelength of the line. Red is the initial best fit to the spectrum using the stellar templates. Green points are the residuals. Top: Ca II λ8542.0. Middle: Na I λλ5889.9, 5895.9 (blended). The masked region (gray) is the He I λ5876 emission line. Bottom: Mg I b λλλ5167.3, 5172.6 (blended), 5183.6.
Other Images in This Article
Show More
Copyright and Terms & Conditions
© 2026. The Author(s). Published by the American Astronomical Society.

Copyright ©
2026 Astronomy Image Explorer. All Rights Reserved.
