

Image Details
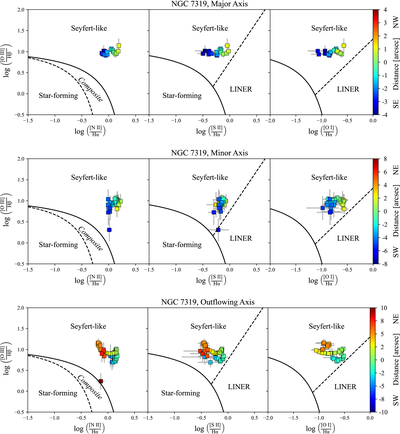
Caption: Figure 10.
BPT diagrams for the nuclear region of NGC 7319, along the major (top) and minor (middle) axes of NGC 7319, and the outflowing axis of the NLR (bottom). For positions that have multiple components, the fluxes from the components have been summed together. Symbols are colored according to their distance from the central SMBH.
Other Images in This Article
Show More
Copyright and Terms & Conditions
© 2026. The Author(s). Published by the American Astronomical Society.

Copyright ©
2026 Astronomy Image Explorer. All Rights Reserved.
