

Image Details
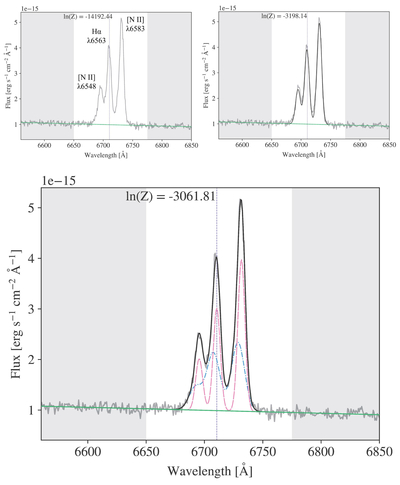
Caption: Figure 3.
Examples of Bayesian Evidence Analysis Tool (BEAT) fitting the Hα λ6563 + [N II] λλ6548, 6583 emission lines near the nucleus of NGC 7319. The gray curve represents the data, while the black curve shows the composite fit. The green line marks the continuum level, and the gray shaded regions are those chosen to calculate the continuum. The vertical purple dashed line is the redshifted rest wavelength of Hα. Top left: the zero-component fit for the data, with key lines labeled. Top right: the one-component fit. Bottom: the two-component fit. The pink and blue curves are the two individual component fits used to create the composite fit. In this case, BEAT finds the two-component fit to be the best model, as indicated by the difference in ln(Z) values. Not shown is the three-component fit, which had a more negative ln(Z) than the two-component fit, and was therefore not chosen.
Other Images in This Article
Show More
Copyright and Terms & Conditions
© 2026. The Author(s). Published by the American Astronomical Society.

