

Image Details
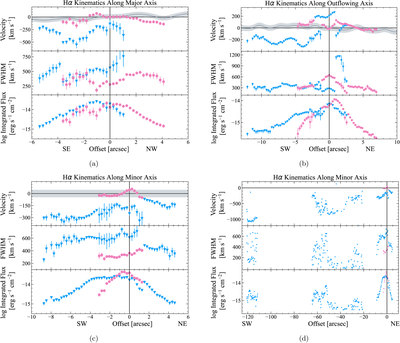
Caption: Figure 6.
Hα kinematic plots along the (a) major axis of NGC 7319, (b) outflowing axis of the NLR, (c) minor axis of NGC 7319 in the nuclear region, and (d) extended region. In each figure, the top panel shows the radial velocity distribution of Hα emission, the middle panel shows the FWHM distribution of each component, and the bottom panel shows the integrated flux distribution. The kinematic components are sorted into rotational motion in pink (circles), and nonrotational motion in blue (triangles). The gray curve running through all velocity plots is the projected rotation curve of NGC 7319.
Other Images in This Article
Show More
Copyright and Terms & Conditions
© 2026. The Author(s). Published by the American Astronomical Society.

Copyright ©
2026 Astronomy Image Explorer. All Rights Reserved.
