

Image Details
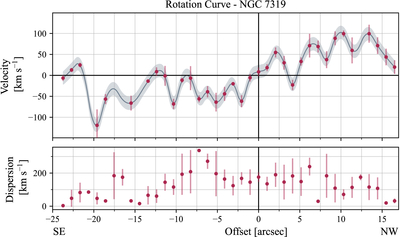
Caption: Figure 5.
Top: rotation curve of NGC 7319 along its major axis. The red points are the averaged velocities from the Ca II, Na I, and Mg I b fits, with propagated errors. The gray curve is an interpolated fit. The shaded area of the curve is the average error of ±15 km s−1. Bottom: velocity dispersions, averaged across the three lines.
Other Images in This Article
Show More
Copyright and Terms & Conditions
© 2026. The Author(s). Published by the American Astronomical Society.

Copyright ©
2026 Astronomy Image Explorer. All Rights Reserved.
