Image Details
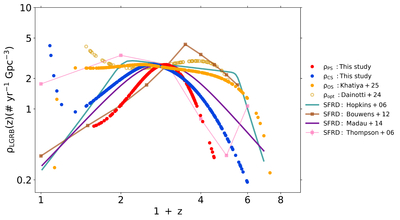
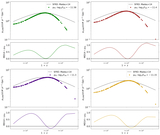
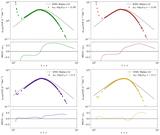
Caption: Figure 3.
The comparison of ρPS(z) and ρCS(z) in this study, with rate densities from the X-ray study of K25 and the optical study of D24a. All other data points/lines correspond to various SFRDs in the literature, as specified in the legend. All curves/data points are renormalized to the PS for better comparison.
Other Images in This Article

Copyright and Terms & Conditions
© 2025. The Author(s). Published by the American Astronomical Society.
Copyright ©
2026 Astronomy Image Explorer. All Rights Reserved.