Image Details
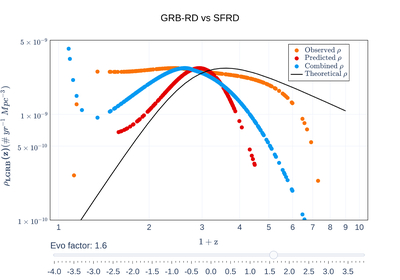
Caption: Figure 4.
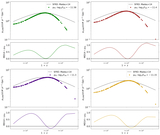
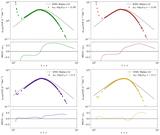
Example figure of ρLGRB(z) in 1 + z space. The orange-filled circles represent the ρOS taken from K25. The red-filled and blue-filled circles represent ρPS and ρCS, respectively. The black solid curve is ρtheor derived from Equation (6) and multiplied with (1 + z)δ. We choose δ = 1.6 as an example for this figure. The interactive figure is available in the online version of the journal, which contains a slider that allows δ to change, thus accounting for the evolution of GRB/progenitor properties. Standard controls, i.e., panning, zooming, and autoscale, are available via the button in the upper-right corner of the interactive figure.
An interactive version of this figure is available in the online article.
An interactive version of this figure is available.
An interactive version of this figure is available in the online journal.
Other Images in This Article
Copyright and Terms & Conditions
© 2025. The Author(s). Published by the American Astronomical Society.