Image Details
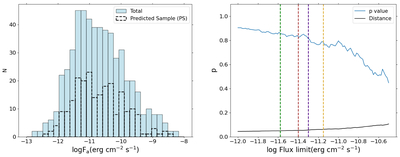
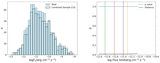
Caption: Figure 5.
Left panel: the z distribution of the total sample, which contains all GRBs with X-ray plateaus detected by Swift and the distribution of the PS. Right panel: the KS test of the two samples in the left panel. We include four cases of F﹩{}_{\mathrm{lim}}﹩ corresponding to a 5%, 10%, 15%, and 20% cut from left to right. The 5% cut has the highest p-value.
Other Images in This Article

Copyright and Terms & Conditions
© 2025. The Author(s). Published by the American Astronomical Society.
Copyright ©
2026 Astronomy Image Explorer. All Rights Reserved.