Image Details
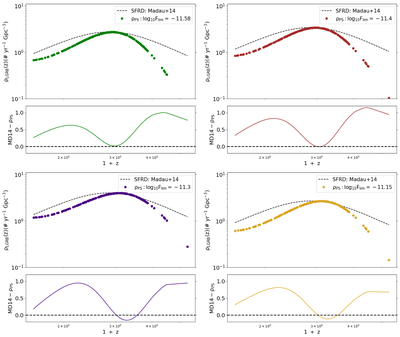
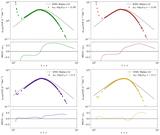
Caption: Figure 6.
ρPS(z) for four flux threshold cases of −11.58, −11.4, −11.3, and −11.15. The filled circles indicate the LGRB-RD corrected for intrinsic luminosity evolution for the PS. The filled circles are color-coded with respect to the vertical dashed lines in the right panel of Figure 5. The black dashed lines show the SFRD from the MD14 study. The peak of SFRD is renormalized to the peak of LGRB-RD for easier comparison.
Other Images in This Article

Copyright and Terms & Conditions
© 2025. The Author(s). Published by the American Astronomical Society.
Copyright ©
2026 Astronomy Image Explorer. All Rights Reserved.