Image Details

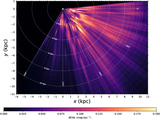
Caption: Figure 14.
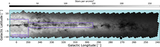
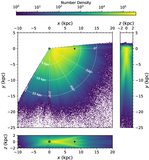
Comparison of the DECaPS dust map (top panel) and the D. Marshall et al. (2025) 3D dust map (bottom panel, restricted to the DECaPS footprint). To better highlight structures over a narrow latitude range, we show the average differential extinction, rather than the integral (as in Figure 11). Both are displayed on the same relative extinction scale and saturate at the 99.5% percentile of the respective reconstruction. Arm models from M. J. Reid et al. (2019) for the Sagittarius-Carina (Sgr-Car) and Scutum-Centaurus (Sct-Cen) arms are overlaid. An interactive version of this figure that allows you to flash back/forth between the panels is available. A version is also available at the author’s Harvard website.
An interactive version of this figure is available in the online article.
An interactive version of this figure is available.
An interactive version of this figure is available in the online journal.
Other Images in This Article
Show More
Copyright and Terms & Conditions
© 2025. The Author(s). Published by the American Astronomical Society.