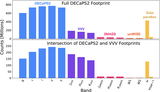
Image Details
Caption: Figure 11.
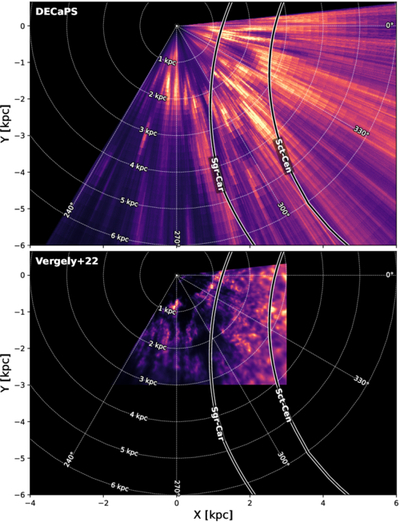
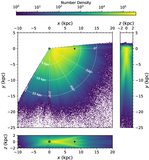
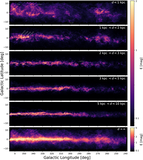
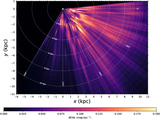
Top-down view of DECaPS 3D dust map (top) alongside the J. L. Vergely et al. (2022) map (bottom, restricted to the DECaPS footprint), each integrated over z = ±400 pc. The J. L. Vergely et al. (2022) map has been restricted to 239° < l < 6° to facilitate comparison with DECaPS over the same longitude range. The Sun is marked with a “⊙” symbol at (x, y) = (0, 0). Both are displayed on the same relative extinction scale and saturate at the 99.95% percentile of the respective reconstruction. Spiral arm models from M. J. Reid et al. (2019) for the Sagittarius-Carina (Sgr-Car) and Scutum-Centaurus (Sct-Cen) arms are overlaid. Within d ≲ 5 kpc, we find that a majority of the massive cloud complexes lie in the interarm region, deviating from log-spiral fits in this region of the Galaxy. An interactive version of this figure that allows you to flash back/forth between the panels is available. A version is also available at the author’s Harvard website (https://faun.rc.fas.harvard.edu/czucker/Paper_Figures/DECaPS_Marshall_Comparison.html).
An interactive version of this figure is available in the online article.
An interactive version of this figure is available.
An interactive version of this figure is available in the online journal.
Other Images in This Article
Show More
Copyright and Terms & Conditions
© 2025. The Author(s). Published by the American Astronomical Society.