Image Details
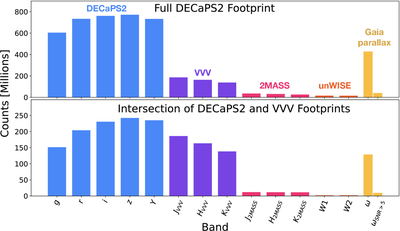
Caption: Figure 4.
Breakdown of the number of stars detected in each photometric band (shown in blue for DECaPS2, purple for VVV, pink for 2MASS, orange for unWISE) and with an available Gaia parallax measurement (shown in yellow). For Gaia, we further subdivide the stars into all those with a Gaia parallax detection and only those with a signal-to-noise ratio on the parallax detection >5. The top panel shows the breakdown of band coverage for the entire DECaPS2 footprint, while the bottom panel shows the breakdown for the subset of the DECaPS2 footprint that overlaps with the VVV footprint (see purple polygon in Figure 3).
Other Images in This Article
Show More
Copyright and Terms & Conditions
© 2025. The Author(s). Published by the American Astronomical Society.