Image Details
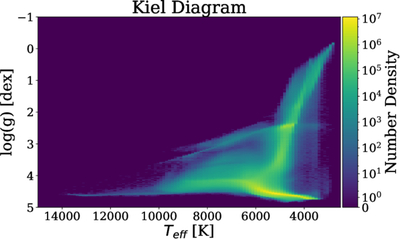
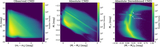
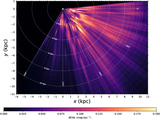
Caption: Figure 7.
Kiel diagram, showing the distribution of two of the inferred stellar parameters, surface gravity, ﹩{\mathrm{log}}\,(g)﹩, as a function of their effective temperature, T eff. We compute the Kiel diagram across the full sample used in the line-of-sight dust reconstruction, totaling 709 million stars.
Other Images in This Article
Show More
Copyright and Terms & Conditions
© 2025. The Author(s). Published by the American Astronomical Society.
Copyright ©
2026 Astronomy Image Explorer. All Rights Reserved.