Image Details
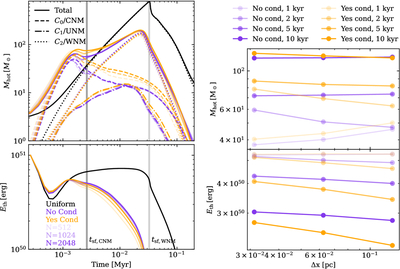
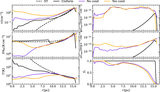
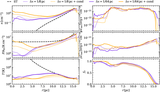
Caption: Figure 8.
Left: evolution of hot gas mass and contribution from different initial phases (top) and evolution of thermal energy of the SNR for different resolutions. Right: mass (top) and thermal energy (bottom) are functions of the cell size at different times. The hot gas is first mainly from the shock-heated CNM, then mainly from the WNM. Due to the significant cooling, the hot gas mass is smaller than in the uniform case. Higher resolution leads to a larger peak hot gas mass at a later time. Thermal conduction increases the hot gas mass by ∼30% between r sf,CNM and r sf,WNM. The is a change by a factor of ∼20% when doubling the resolution.
Other Images in This Article
Show More
Copyright and Terms & Conditions
© 2025. The Author(s). Published by the American Astronomical Society.