Image Details
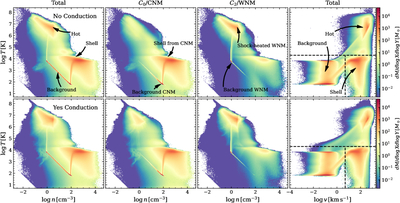
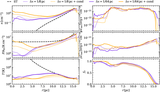
Caption: Figure 7.
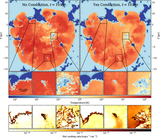
T − n joint distribution for all gas (first column), gas that is initially CNM (species C 0; second column) and WNM (species C 2 ; third column), and T − v joint distribution (last column) of the gas at 10 kyr (t/t sf,WNM ≈ 0.3, t/t sf,CNM ≈ 4) without (upper panel) and with (lower panel) thermal conduction. Annotated are the main components of the ISM, along with a significant fraction occupying intermediate regions. Dashed lines in the last column mark the boundary of ∣v∣ = 5 km s−1 and T = 5050 K used for the definition of gas phases to distinguish the three components. Thermal conduction increases the contribution of CNM to hot gas.
Other Images in This Article
Show More
Copyright and Terms & Conditions
© 2025. The Author(s). Published by the American Astronomical Society.