Image Details
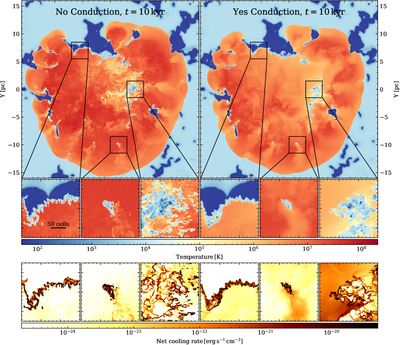
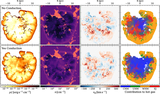
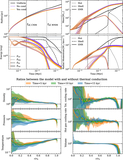
Caption: Figure 4.
Top: slices of temperature through the z = 0 plane of the SNRs at 10 kyr (t/t sf,WNM ≈ 0.3, t/t sf,WNM ≈ 4) without (left) and with (right) thermal conduction. Middle: zoom-ins of selected regions showing (from left to right) nonlinear thin-shell instability, single shock–cloud interaction, and turbulent mixing. Bottom: net cooling rate of the same selected regions.
Other Images in This Article
Show More
Copyright and Terms & Conditions
© 2025. The Author(s). Published by the American Astronomical Society.
Copyright ©
2026 Astronomy Image Explorer. All Rights Reserved.