Image Details
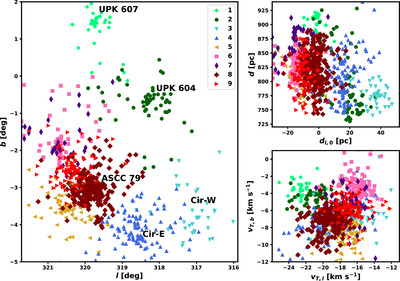
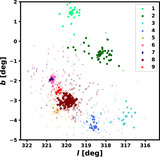
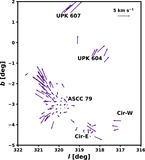
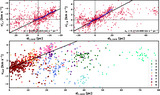
Caption: Figure 5.
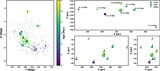
Subgroups identified with HDBSCAN in Circinus. In the left panel, we plot these populations in l vs. b galactic sky coordinates, while we show the distribution of stars in distance vs. sky-plane distance in the l direction relative to the mean in the top right panel, and the transverse velocity distribution in the bottom right panel.
Other Images in This Article
Show More
Copyright and Terms & Conditions
© 2025. The Author(s). Published by the American Astronomical Society.
Copyright ©
2026 Astronomy Image Explorer. All Rights Reserved.