Image Details
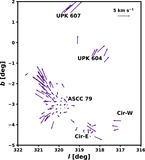
Caption: Figure 10.
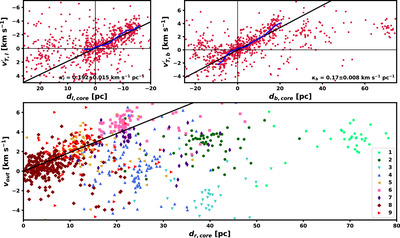
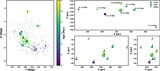
Expansion signatures in Circinus. The top row shows the transverse velocity in l (left) and b (right), corrected for virtual expansion, plotted against position along the l and b axes. Positions and velocities are both given relative to the mean in the central cluster (ASCC 79). The axes for the l plot are inverted to match the form of the b plot, with CIR-6/7 to the right. We show fits to the position–velocity trends as black lines, with the best-fit expansion rate annotated in the lower right. The blue curve shows the median velocity by bin in l and b, which traces deviations from this fit. The bottom plot shows positions and velocities by Circinus subgroup, plotted using the markers from Figure 3. Velocities and positions are computed radially from the center of ASCC 79 in the plane of the sky, and the expansion fit in l is shown for reference as a solid black line.
Other Images in This Article

Show More
Copyright and Terms & Conditions
© 2025. The Author(s). Published by the American Astronomical Society.