Image Details
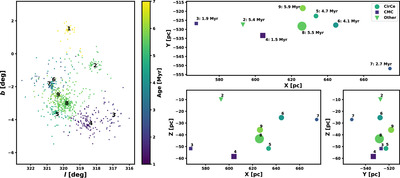
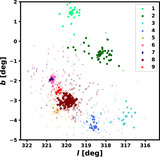
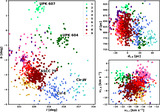
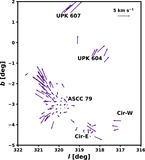
Caption: Figure 7.
In the left panel, a sky-coordinate map of the Circinus Complex, with subgroups colored by their ages. In the right three panels, a cross section of the same distribution in galactic Cartesian coordinates, marking the mean position of each group rather than individual stars, to suppress the visual impact of the high uncertainties in the distance axis. The markers are scaled with the mass of the subgroup (see Section 5). Circle markers are associated with the CirCe region (see Section 7.1), squares with the CMC, and triangles with other populations. We exclude UPK 607 (CIR-1) from the right panels, due to its outlying position. A 3D interactive version of the cross section in the right panels is provided in the online-only version of this paper.
An interactive version of this figure is available in the online article.
An interactive version of this figure is available.
An interactive version of this figure is available in the online journal.
Other Images in This Article
Show More
Copyright and Terms & Conditions
© 2025. The Author(s). Published by the American Astronomical Society.