Image Details
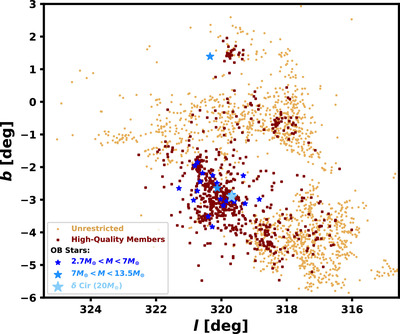
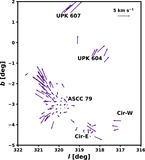
Caption: Figure 3.
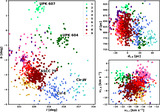
Sky distribution of our high-quality member sample used for structural analysis (dark red, matching Figure 2), plotted against the photometrically young heavily reddened stars removed in Section 2, which have velocities broadly consistent with field contaminants (tan). The distribution of these contaminants is consistent with the known distribution of dust in the area. We also mark O and B stars with blue star markers. The size and shade corresponds to their mass calculated by comparison to PARSEC isochrones, ranging from small dark markers for stars with M < 7M⊙, to large light markers for the δ Cir system, which has a 20M⊙ primary.
Other Images in This Article
Show More
Copyright and Terms & Conditions
© 2025. The Author(s). Published by the American Astronomical Society.