Image Details
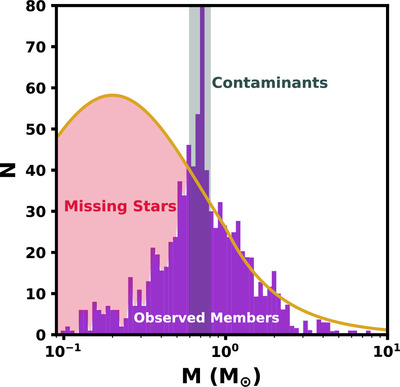
Caption: Figure 8.
Histogram showing the distribution of masses among observed stars in Circinus, shown in purple, plotted alongside the G. Chabrier (2005) individual-object IMF, scaled to the histogram across the mass range M > 0.8M⊙, which is displayed as a yellow curve. The area to the left of the last crossover point between the histogram and scaled IMF is the volume occupied by missing stars, and in Section 6.2, we use this area to compute corrective factors of 1.36 for mass and 2.28 for number. The gray-shaded area marks a contaminant feature, which appears to be produced by a combination of model issues and field contaminants.
Other Images in This Article
Show More
Copyright and Terms & Conditions
© 2025. The Author(s). Published by the American Astronomical Society.