Image Details
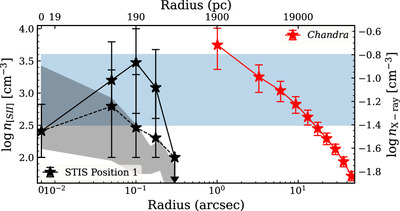
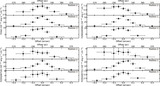
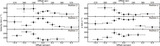
Caption: Figure 15.
Density estimated from the ratio of the [S II] emission lines (black) for the ionized gas along the slit Position 1, as well as from the ICM electrons from projected Chandra X-ray observations (red). The northeast offset (radius) for STIS observations is plotted by the solid line, and the dashed line represents the offset toward the southwest direction from the central AGN. The density near the vicinity of the central SMBH (r ≲ 600 pc) shows a notably flat distribution within the errors. The shaded region in black shows the estimate of the density of cold gas measured from MHD simulations. The shaded region in blue simply highlights the extent of the flat profile throughout the core in both ionized and X-ray gas.
Other Images in This Article
Show More
Copyright and Terms & Conditions
© 2025. The Author(s). Published by the American Astronomical Society.