Image Details

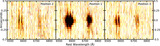
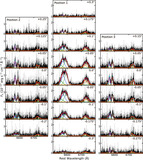
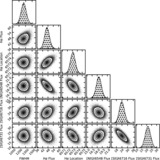
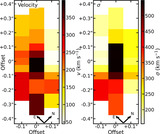
Caption: Figure 8.
2D flux maps for the emission lines detected in HST/STIS observation of PKS 0745-191. The highest emission-line fluxes are observed at the central spexels and generally decrease away from the center. The N-E coordinate directions are represented in the figure that reflects the position angle used with the STIS slits.
Other Images in This Article
Show More
Copyright and Terms & Conditions
© 2025. The Author(s). Published by the American Astronomical Society.
Copyright ©
2025 Astronomy Image Explorer. All Rights Reserved.