Image Details
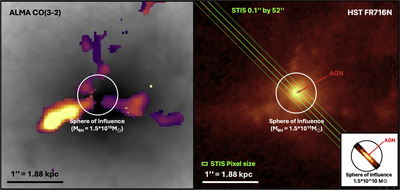
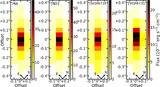
Caption: Figure 4.
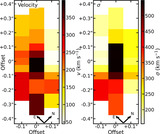
Zoom-in onto the BCG in PKS 0745-191 in a 4″ by 4″ box. Left: Atacama Large Millimeter/submillimeter Array (ALMA) CO(3-2) flux map showing a lack of emission in the central region. Right: ACS FR716N narrow-band image that covers Hα/[N II] emission lines. We highlight the location of the three STIS slits, each with a size of 0﹩\mathop{.}\limits^{\unicode{x02033}}﹩1 by 52″, as well as the size of each pixel along the slit. In addition, we show the sphere of influence for a 1.5 × 10¹⁰ M⊙ SMBH. Right-inset: zoom-in on the Hα flux map measured from the STIS observations, with the sphere of influence overplotted.
Other Images in This Article
Show More
Copyright and Terms & Conditions
© 2025. The Author(s). Published by the American Astronomical Society.