Image Details
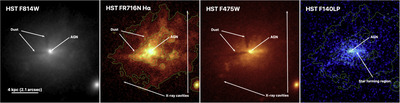
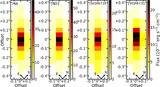
Caption: Figure 3.
HST images of the BCG in PKS 0745-191. Left: WFPC2 F814W filter tracing the older stellar population, including prominent dust lanes. Middle-left: ACS FR716N narrow-band image that spans the wavelength range covering the Hα/[N II] emission lines. Contours start at 3σ and increase by factors of two. We highlight the location of the X-ray cavities as seen on the right panel of Figure 1. Middle-right: ACS F475W image tracing the B-band emission. Right: SBC F140LP image tracing the star formation ( ~20 M⊙ yr−1) with FR716N narrow-band image contours overlaid. We highlight the location of the AGN and the star-forming region. The Hα/[N II] emission trail behind the X-ray cavities is as in Figure 1.
Other Images in This Article
Show More
Copyright and Terms & Conditions
© 2025. The Author(s). Published by the American Astronomical Society.