Image Details

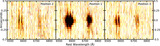
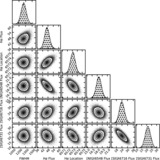
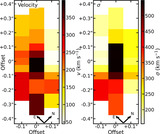
Caption: Figure 5.
Best-fitting models for the continuum-subtracted spectra extracted from the pixels with emission-line detection at three slit locations (Positions 2, 1, and 3 from the leftmost column). The full model that contains Hα, [N II], and [S II] emission lines is plotted in red, and each emission-line components are plotted in blue, green, and orange, respectively (longer wavelength transitions in the doublets are shown with dashed lines). The continuum-subtracted spectra and the uncertainties are plotted in black and gray, respectively. We note that the pixels far from the center were binned together. The cyan shade represents a 95% confidence region extracted from the MCMC posterior sampling calculated using emcee package. The fit results are tabulated in Table 1.
Other Images in This Article
Show More
Copyright and Terms & Conditions
© 2025. The Author(s). Published by the American Astronomical Society.