Image Details
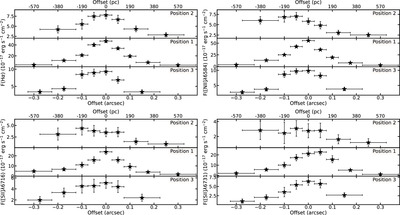
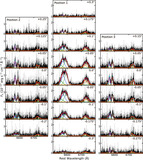
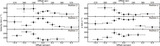
Caption: Figure 7.
The flux measured from Hαλ6563, [N II]λ6584, [S II]λ6716, and [S II]λ6731 emission lines as a function of location along the three slit positions. The vertical error bars represent the 1σ measurement uncertainties, and the widths of the pixels from which the spectra were extracted are shown as horizontal error bars. In the spectral models, the flux ratio between the [N II]λλ6548, 6584 was held at 1:3.
Other Images in This Article
Show More
Copyright and Terms & Conditions
© 2025. The Author(s). Published by the American Astronomical Society.
Copyright ©
2025 Astronomy Image Explorer. All Rights Reserved.