Image Details
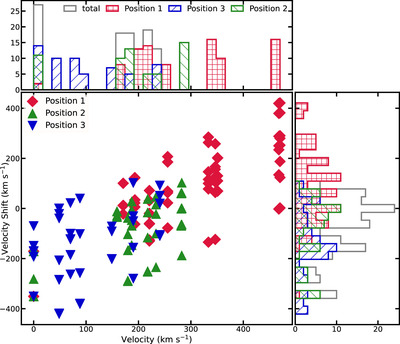
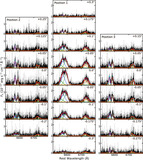
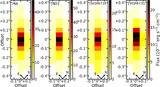
Caption: Figure 14.
Distribution of velocity shifts between neighboring STIS pixels as a function of velocity. The chaotic nature of ionized gas kinematics is highlighted with velocity shifts reaching up to ±400 km s−1 between adjacent pixels. Position 1, which encompasses the nucleus, shows predominantly positive velocity shifts, while Positions 2 and 3 exhibit more negative shifts, highlighting the disturbed flow of gas near the AGN.
Other Images in This Article
Show More
Copyright and Terms & Conditions
© 2025. The Author(s). Published by the American Astronomical Society.
Copyright ©
2025 Astronomy Image Explorer. All Rights Reserved.