Image Details
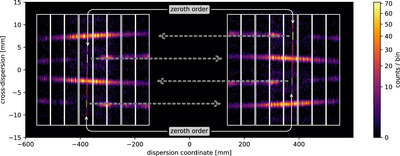
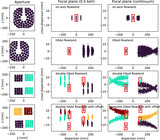
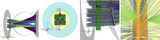
Caption: Figure 9.
Simulation of an Arcus observation of an emission line spectrum (see Section 5 for details). Positions of the CCDs are outlined with white frames and the zeroth orders are indicated. Dashed arrows mark the dispersion direction of the four spectra from the zeroth order. Only photons that are detected on a CCD are included. Note that the dispersion and cross-dispersion directions are scaled differently. The cross-dispersion direction is parallel to the coordinate system z-axis. The dispersion direction is measured along the curved Rowland circle; any given location on this plot is within 5 deg of the coordinate system y-axis.
Other Images in This Article
Copyright and Terms & Conditions
© 2024. The Author(s). Published by the American Astronomical Society.