Image Details
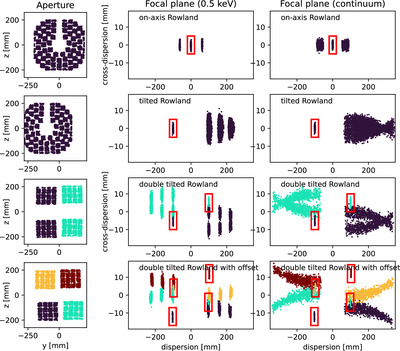
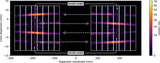
Caption: Figure 7.
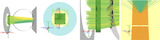
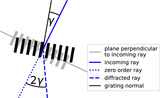
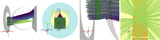
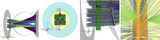
Distribution of photons on the detectors for different designs. Left: Location where photons pass the aperture and SPOs. Right: Location photons on a curved detector projected onto the focal plane for a monoenergetic source. Photons are colored by channel and the positions of the respective zeroth orders are highlighted with red boxes. Note that the dispersion (along the y-axis) and cross-dispersion (z-axis) directions are not to scale. Our toy example detects order −1 and +1 for the on-axis Rowland torus and orders −3, −4, and −5 for the tilted Rowland tori. In the lower two panels, the zeroth orders of one channel overlap with the dispersed photons from another channel. This could be avoided with larger offsets between channels in cross-dispersion direction. Also, in real instruments with focal lengths significantly larger than in the illustrative model we use throughout this article, the bending and the width in cross-dispersion direction are typically smaller, so that this is not a problem in practice. Right: Same as in the middle row, but for a continuum source. Again, photons for a specific energy are detected in several orders, but photons from other energies are detected in different locations, so the orders cannot be separated based only on their spatial location.
Other Images in This Article
Copyright and Terms & Conditions
© 2024. The Author(s). Published by the American Astronomical Society.