Image Details
Caption: Figure 4.
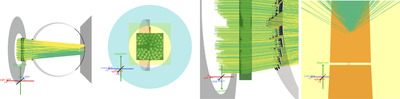
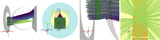
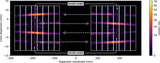
Three-dimensional images of the ray-trace for a source with a continuum spectrum over a limited bandpass, seen (from left to right) from the side, from the top (where the rays enter the aperture), a zoom-in on the grating positions, and a zoom-in on the detector. Rays are shown from the entrance aperture on. They pass a focusing mirror represented by a green box and get diffracted by gratings (white squares). They are detected by CCDs (orange). Rays are colored by the diffraction order: zero-order photons are light green. A section of the Rowland torus is shown as transparent gray. The large square on the right indicates the position of the focal plane. Rays are traced past the detectors to the focal plane to show how the CCDs on the Rowland circle capture the rays where the dispersion width is smallest—past the CCDs, the rays widen in dispersion direction again, but still become narrower in cross-dispersion direction. This figure is interactive, allowing the reader to pan, zoom, and rotate to see those details and inspect the rays from all angles. (Use the mouse to rotate, mouse wheel to zoom, and double-click to focus on a particular element. Right click to navigate to the predefined viewpoints shown in the static figure. On other devices, other native controls might be available, e.g., two-finger touch to zoom on touchscreens.)
An interactive version of this figure is available in the online article.
An interactive version of this figure is available.
An interactive version of this figure is available in the online journal.
Other Images in This Article
Copyright and Terms & Conditions
© 2024. The Author(s). Published by the American Astronomical Society.